Grouping similar things is something humans do naturally, arranging books by genre or organizing food by type. Machine learning has a way to mimic this through clustering. It's a method used to find patterns and organize data into groups without predefined labels.
This technique is part of unsupervised learning and plays a big role in customer segmentation, image sorting, and behavioral analytics. Since the data isn't labeled, clustering helps machines explore and organize it in a meaningful way. The process depends heavily on the algorithm used to detect similarity.
What Is Clustering and Why Does It Matter?
Clustering finds hidden patterns in data. It works without supervision, meaning there are no labels telling the algorithm what each group should be. Instead, it looks for data points that naturally fit together. This kind of learning is useful when dealing with large amounts of raw data where no prior categorization exists.
One common use is customer segmentation, where businesses look to understand different buyer types based on behavior. In research, it helps in genetic analysis or grouping similar documents. Clustering can even spot outliers, which might represent unusual or interesting behavior in the data.
The strength of clustering lies in its flexibility. It doesn’t require labeled examples, so it can be used in a wider range of situations than many supervised learning methods. It can also offer new insights by revealing groupings that weren’t obvious from the start. That said, clustering has its limits—it can be affected by how the data is structured or scaled, and how similar items are defined.
Types of Clustering Algorithms and How They Work
There are several types of clustering algorithms, each offering a different way to interpret and group data.
K-Means Clustering
K-means is among the most used methods. It starts by selecting a number of clusters, “k,” and randomly placing that many centroids. Each data point is assigned to the nearest centroid. The centroids are then recalculated, and this continues until the assignments stop changing.
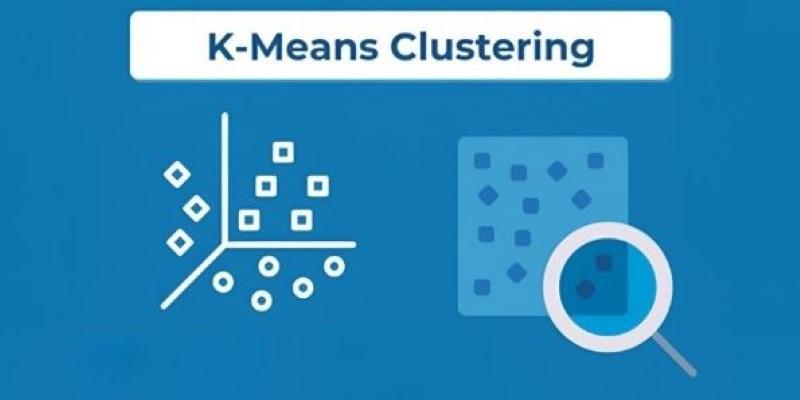
K-means is fast and works well when the data has clear, round-shaped groupings. But it doesn’t perform as well when clusters vary in size or shape. It also needs you to decide the value of k in advance, which isn’t always easy to estimate.
Hierarchical Clustering
Hierarchical clustering builds a hierarchy of clusters. This can be done in two ways: either by merging smaller clusters into bigger ones (agglomerative), or by splitting a big cluster into smaller ones (divisive). The result is often visualized using a dendrogram, which shows the nested grouping structure.
This approach doesn’t require knowing how many clusters are needed at the start. It’s good for understanding how groupings evolve at different levels. However, it doesn’t scale well for very large datasets and can be sensitive to noise.
DBSCAN
DBSCAN groups data based on density. It defines clusters as areas of high point density and labels sparse points as noise. This makes it effective for datasets where clusters have irregular shapes or when noise needs to be detected.
It doesn't need you to pick the number of clusters in advance, which is a plus. But it does require two other parameters: the distance threshold and the minimum number of points for a cluster. It can struggle if the dataset has varying densities.
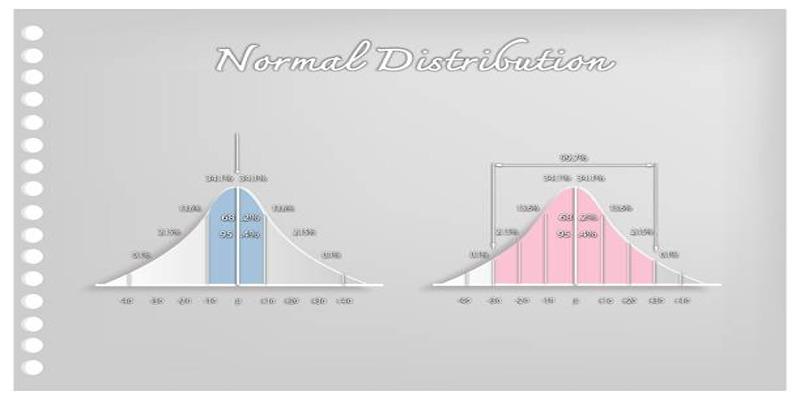
Gaussian Mixture Models (GMM)
GMM assumes the data is generated from a mix of Gaussian distributions. It assigns a probability to each point for belonging to each cluster, unlike K-means, which uses hard assignments. A point can belong partially to multiple clusters.
This soft clustering method is useful when cluster boundaries are unclear. It's more flexible than K-means, especially when clusters overlap. But GMM is computationally more expensive and may not perform well if the data doesn’t fit a Gaussian distribution.
Challenges and Considerations in Clustering
Clustering algorithms don't come with a one-size-fits-all promise. Their success often depends on how well the data fits the assumptions made by each method.
One challenge is choosing the right number of clusters. K-means needs this as an input, but often there is no obvious answer. Methods like the elbow method or silhouette score can help, but they don’t always give a clear result. In hierarchical clustering, the decision about where to “cut” the tree to form clusters can be subjective.
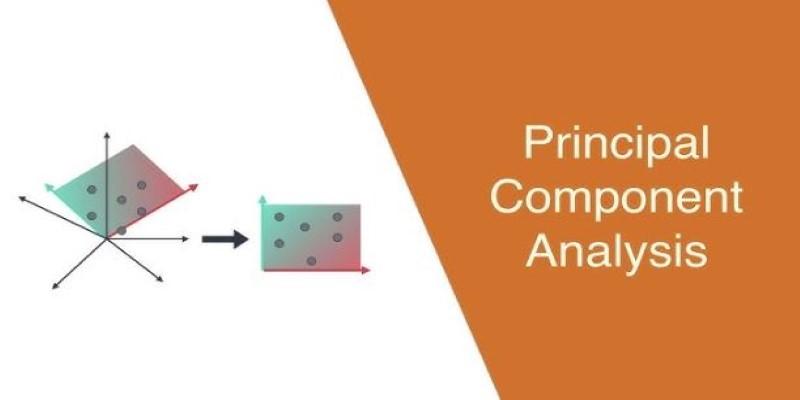
Another issue is dealing with high-dimensional data. As the number of dimensions increases, it becomes harder to calculate meaningful distances between points—a problem known as the “curse of dimensionality.” Dimensionality reduction techniques like PCA (Principal Component Analysis) are often used to simplify the data before clustering.
Outliers can also distort results. K-means is particularly sensitive to them, often pulling centroids away from the true center of a cluster. DBSCAN handles this better by labeling outliers as noise, but it can struggle if clusters have very different densities.
Feature scaling is another important and necessary factor. Since most clustering algorithms rely on distance metrics, features with larger scales can easily dominate the outcome. Standardizing or normalizing data can help make sure that all features contribute fairly to the clustering process.
Conclusion
Clustering algorithms are a key part of unsupervised learning. They help organize unlabelled data into meaningful groups, revealing trends or hidden relationships. Each method—K-means, hierarchical, DBSCAN, and GMM—comes with its own strengths and weaknesses, shaped by the structure and size of the dataset. The choice of algorithm depends on many factors, including the shape of the data, the number of clusters expected, and how clean or noisy the dataset is. While clustering doesn’t always deliver perfect results, it provides a useful foundation for deeper analysis. It's a practical and often overlooked tool that supports many real-world systems, from online platforms to scientific discovery.