For each classification model, selecting the appropriate evaluation criteria is crucial. This decision influences user trust, deployment success, and ultimately, the choice of final model. Begin by defining project objectives, constraints, and acceptable risks. Evaluate label quality, class balance, and potential costs of prediction errors.
Choose metrics that have a clear connection to user safety and business outcomes. Provide stakeholders with concise explanations when presenting metric choices. Combine complementary metrics to highlight trade-offs between positive and negative classes. Before final selection, verify metric stability using real holdout sets and cross-validation. Regularly review selected criteria as data, goals, or costs evolve. Involve stakeholders early and often to ensure alignment and buy-in.
Define The Problem And Cost Matrix
Before selecting evaluation metrics, clearly define the classification problem. Determine whether the task is binary, multiclass, or multilabel. Calculate the monetary or human costs associated with false positives and false negatives. Translate costs into a clear loss function or cost matrix for model training. Account for skewed classes where minority labels demand higher accuracy or sensitivity.
Reports should detail the effects of misclassification on users, operations, or compliance requirements. Align the choice of metrics with the model's automated downstream decisions. Consult domain experts beforehand to validate anticipated effects and edge cases. In both development and production environments, prioritize metrics that minimize the greatest anticipated harm while still being quantifiable and auditable. Regularly document the reasoning in version control.
Why Accuracy Alone Is Often Insufficient
The percentage of accurate predictions over all predictions is reported by accuracy. When there is a significant imbalance in the distribution of classes, accuracy can be deceptive. High accuracy can hide poor performance on rare but critical classes. In practice, only use accuracy when classes have comparable prevalence and error costs. When minority classes influence user safety and business outcomes, choose more illuminating metrics.
For clear diagnostics and audits, report class-wise accuracy and confusion matrix entries. Combine accuracy with precision or recall for a fuller view that reflects real-world trade-offs. Use stratified cross-validation to avoid inflated estimates and obtain realistic accuracy under sampling variation. When feasible, choose metrics that clearly represent user impact and business objectives. Regularly include model explainability in performance reports.
Precision, Recall, and F1 Explained
The percentage of true positives among predicted positives is known as precision. Recall is the proportion of actual positives that the model correctly identifies as such. When false positives are expensive or detrimental to users or systems, use precision. When missing positive cases is more expensive for operations than false alarms, use recall. For single summaries where both errors are significant, the F1 score uses a harmonic mean to balance recall and precision.
F1 works well for tasks where the downstream effects of false positives and false negatives are about equal. Report precision and recall separately to keep stakeholders aware of trade-offs. Depending on operational requirements and limitations, modify decision thresholds to trade recall for precision. If classes have different utilities and risk profiles, use class-specific thresholds. Record can be chosen thresholds and their rationale in deployment runbooks for audit purposes. Throughout production operation cycles, monitor recall drift and precision.

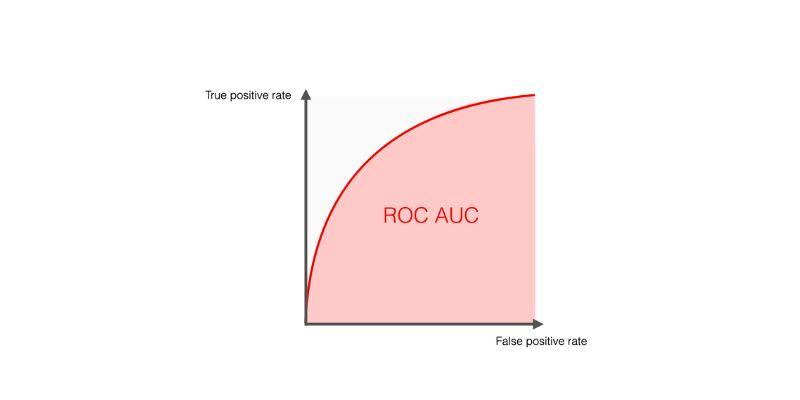
ROC AUC and PR AUC: When To Use Each
The ROC AUC summarizes the trade-offs between the true positive rate and the false positive rate across various thresholds. When classes are evenly distributed or when overall ranking is more important than a single operating point, the ROC AUC is helpful. PR AUC highlights precision behavior and focuses on positive class performance in imbalanced datasets. When positive labels are scarce and you are most concerned with positive predictions, choose PR AUC.
ROC curves may appear favorable even when recall is poor in highly skewed datasets with a small number of positive cases. To verify predicted probabilities and dependability, use calibration plots in conjunction with ROC or PR curves. Compare models at relevant operating points rather than relying only on AUC values. Establish operating points by selecting thresholds based on utility or cost curves informed by business considerations. Regularly evaluate the AUC estimate of production uncertainty using bootstrapped confidence intervals to assess its accuracy.
Calibration And Probability Metrics
Reliable decision-making is supported by calibrated probabilities, which represent the actual likelihood of favorable outcomes. Poor calibration can mislead decision rules that rely on probabilities for costs or alerts. Use reliability diagrams and expected calibration error to evaluate calibration across bins and subgroups. When necessary, use Platt scaling or isotonic regression to address systematic probability biases. Verify calibration across subgroups to meet audit requirements and avoid unfair misestimation for particular populations.
Stakeholders can set thresholds and make cost-sensitive decisions with confidence when using well-calibrated models. For a single summary, present the Brier score as a sum of the calibration and overall prediction error. Compared to other loss options, training objectives that maximize log loss frequently produce more accurately calibrated probability outputs. Models should be periodically recalibrated when label processes or input data distribution in production systems change.
Confusion Matrix, Class Weighting, And Diagnostic
For a selected threshold, the confusion matrix displays the numbers of true negatives, false negatives, false positives, and true positives. It helps examine error distribution across classes and thresholds in a simple table. When class sizes vary significantly across labels and deployments, normalize rows or columns to compare performance. Apply class weighting or resampling to address severe class imbalance that weakens minority detection.
Resampling may change the distribution the model expects in deployment, so use it cautiously. Use confusion matrix analysis with domain costs to set thresholds that minimize harm. Utilize the confusion matrix's per-class recall and precision for thorough diagnostics and prioritization. When the importance of false positives and false negatives varies, consider the class F beta scores. To find regressions, keep confusion matrices across releases.
Conclusion
Selecting suitable evaluation criteria is the first step toward dependable model results. Before training starts, choose metrics that are relevant to the issue, expenses, and user impacts. Use complementary metrics to report trade-offs across classes and thresholds clearly. Before deployment, confirm selections using calibration checks, holdouts, and strong cross-validation. Continuously monitor performance, drift, and operational impact to maintain model safety and usefulness. Inform stakeholders and record choices to facilitate audits and iterative enhancements. Prioritize quantifiable benefits and quickly modify criteria when evidence quickly reveals a different risk profile.